
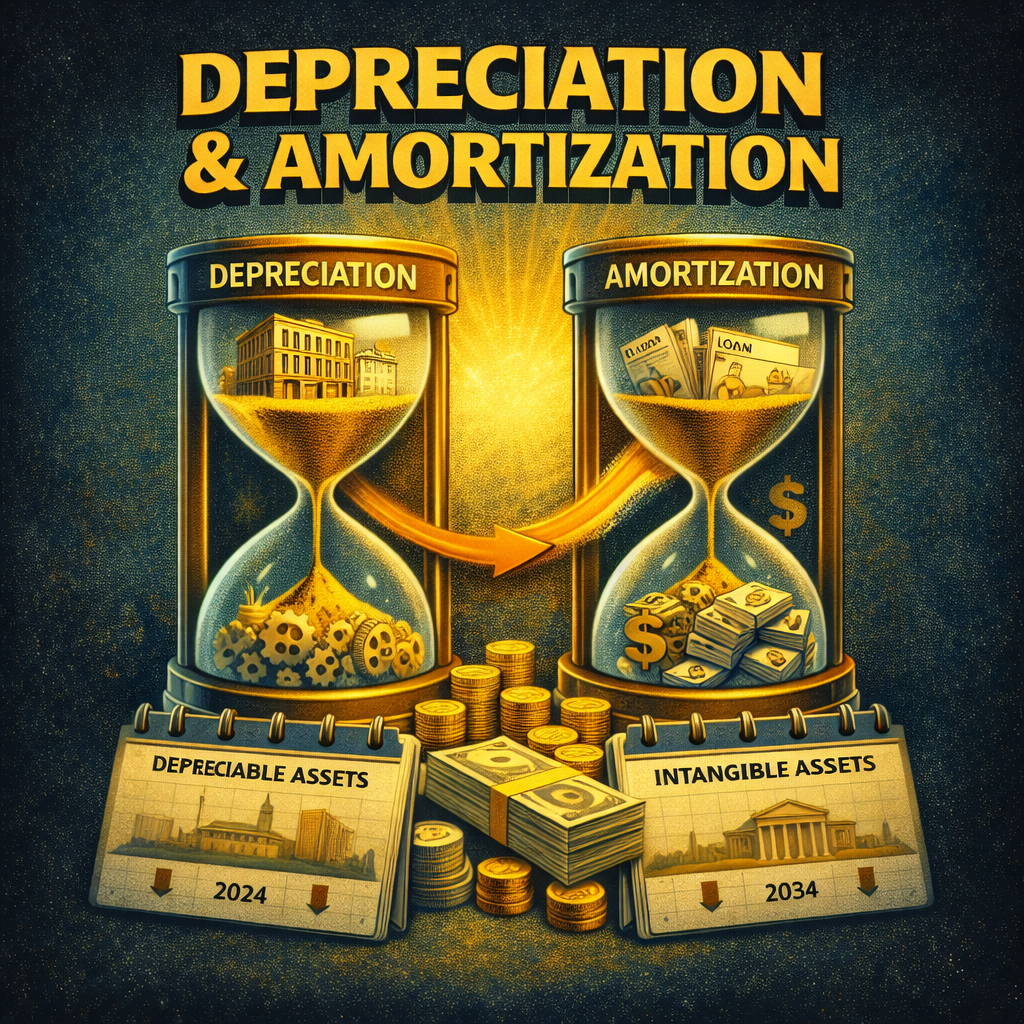
Depreciation & Amortization
“D & A: The silent MVP of your bottom line.”
Depreciation and Amortization (D&A) are accounting methods that systematically allocate the cost of business assets over their useful life.
D&A costs are recorded over time as expenses, gradually matching the asset’s original cost to the periods in which it provides value.
These non-cash accounting concepts help spread the cost of assets over time, give a more accurate picture of profitability, and may influence key decisions about investment, taxes, and financing.
Depreciation applies to physical (tangible) assets like vehicles, machinery, equipment, and buildings.
It reflects how these items lose value over time due to wear and usage.
Amortization applies to intangible assets like software, patents, or trademarks.
It represents the gradual reduction of their value over their useful life.
Although these expenses don’t involve actual cash leaving the business,
they are recorded to show how the value of assets decline over time.
D&A on Financial Statements
| Statement | How D&A Appears |
|---|---|
| Income Statement | As an expense, reducing net income. |
| Cash Flow Statement | Added back to net income in operating activities (non-cash adjustment). |
| Balance Sheet | As Accumulated Depreciation (or Accumulated Amortization), which reduces the book value of fixed assets.* |
* Fixed assets are recorded at their original purchase cost on the balance sheet, but over time, accumulated depreciation is subtracted to reflect the asset’s declining value. This results in the asset’s net book value — the amount still recognized as having economic benefit.
Depreciation Example: Delivery Van
Asset: Delivery Van
Original Cost: $90,000
Useful Life: 5 years
Depreciation Method: Straight-Line
Annual Depreciation: $90,000 ÷ 5 = $18,000/year
📊 Depreciation Schedule
Year | Annual Depreciation | Accumulated Depreciation | Book Value at Year-End |
Year 1 | $18,000 | $18,000 | $72,000 |
Year 2 | $18,000 | $36,000 | $54,000 |
Year 3 | $18,000 | $54,000 | $36,000 |
Year 4 | $18,000 | $72,000 | $18,000 |
Year 5 | $18,000 | $90,000 | $0 |
💡 Breakdown:
- Original Cost: The price paid to acquire the asset (e.g., $90,000 for a delivery van).
- Accumulated Depreciation: The total amount of depreciation recorded to date (e.g., $54,000 after 3 years).
- Book Value (Net of Depreciation):
Original Cost − Accumulated Depreciation = Net Book Value
Example: $90,000 − $54,000 = $36,000
💬 What This Tells You:
- You record $18,000 in depreciation expense each year.
- The book value of the asset drops consistently until it hits zero in Year 5.
- Even if the van is still operational after 5 years, it’s now fully depreciated for accounting and tax purposes.
Common Types of Depreciation Methods
✅ Straight-Line Depreciation
- How it works: Spreads the cost of an asset evenly over its useful life.
- Often used for: Assets that provide consistent value year after year (e.g., office furniture, buildings).
- Pros: Simple, predictable, widely accepted for financial and tax reporting.
📉 Declining Balance Depreciation
(Also known as Double Declining Balance when accelerated)
- How it works: Applies a fixed percentage to the asset’s remaining book value each year, resulting in higher expenses early in the asset’s life.
- Often used for: Tech equipment, vehicles, or machinery that loses value quickly.
- Pros: Matches higher initial usage and obsolescence.
⚙️ Units of Production Depreciation
- How it works: Depreciation is based on how much the asset is used, not just time.
- Often used for: Manufacturing equipment, vehicles (based on miles), printers, or machines with trackable output.
- Pros: Highly accurate for usage-based assets.
🏢 MACRS (Modified Accelerated Cost Recovery System) (U.S. Tax Only)
- How it works: IRS-mandated system with predefined depreciation schedules based on asset class.
- Best for: Tax reporting for U.S. businesses.
- Pros: Maximizes tax deductions early, aligns with IRS rules.
🛠️ Practical Examples
| Asset | Accounting Treatment (can vary) |
|---|---|
| Office Furniture | Depreciated over 7 years (straight-line) |
| Company Website | Amortized over 3 years |
| Warehouse Building | Depreciated over 39 years (per IRS guidelines) |
| Franchise Rights | Amortized over the contract term |
| Retail Point-of-Sale System | Depreciated over 5 years |
| Trademark (registered) | Amortized over 10 years (or indefinite if renewable) |
| Construction Equipment | Depreciated using declining balance method |
| Custom ERP Software | Amortized over 5 years |
| Land Improvements (e.g., fencing) | Depreciated over 15 years |
| Leasehold Improvements | Amortized over the shorter of useful life or lease term |
Why D&A Matter for Business Owners & Decision Makers
True Profitability
D&A are non-cash expenses, meaning they reduce accounting profit without affecting your cash on hand. This is why your business may look less profitable on paper than it actually is in terms of cash flow.
Tax Advantages
Depreciation and amortization can reduce your taxable income, lowering your tax bill. This makes D&A an important tool in your tax strategy.
Budgeting for the Future
Understanding how assets lose value helps you plan ahead for repairs, upgrades, or replacements—protecting operations and cash flow.
Better Financial Analysis
Lenders and investors often focus on EBITDA (Earnings Before Interest, Taxes, Depreciation, and Amortization) as a key measure of operating performance. EBITDA strips out D&A to focus on core profitability.
Common D&A FAQs
Q: Do I need to track depreciation myself?
A: Your accountant usually handles it, but it’s vital you understand how it impacts profit and asset values.
Q: Does depreciation affect cash flow?
A: No—it’s a non-cash expense. But it does affect reported profit and taxable income.
Q: What happens when an asset is fully depreciated but still in use?
A: It stays on the books at salvage value with no further depreciation.
Q: Can depreciation be reversed?
A: Not typically, unless due to an error.
Why You Need an Accountant for D&A
Depreciation and amortization aren’t just bookkeeping chores—they require strategic decisions about asset classification, useful life, tax treatment, and compliance with accounting standards.
A qualified accountant can:
- Choose the right depreciation method for each asset
- Ensure you’re maximizing tax benefits without raising red flags
- Keep your financial statements accurate and audit-ready
- Help align your D&A strategy with loan covenants or investor expectations
In short, working with an accountant helps turn D&A from a technical task into a financial advantage.
D&A Impact on Business Financing & Credit Underwriting
Non-Cash Expense That Improves Cash Flow
- D&A reduce accounting profit without affecting actual cash flow.
- Lenders often look at EBITDA (Earnings Before Interest, Taxes, Depreciation & Amortization) to measure a company’s operating performance before non-cash deductions.
- A higher EBITDA can make your business appear more creditworthy because it reflects stronger core cash-generating ability.
Key Part of Loan Covenant Calculations
- Many loans have covenants tied to EBITDA-based ratios (e.g., Debt/EBITDA, EBITDA Interest Coverage).
- Because D&A are added back when calculating EBITDA, they enhance these ratios, making it easier to meet lender requirements.
Asset Valuation and Collateral
- Depreciation affects the book value of fixed assets, which are often used as collateral.
- Underwriters may adjust the value of assets down based on accumulated depreciation when determining loan-to-value (LTV) ratios.
- Excessively depreciated assets may reduce available collateral, especially in asset-based lending.
Predictability and Transparency
- A consistent and logical D&A schedule signals good financial management and accurate forecasting.
- Sudden changes or aggressive depreciation can raise red flags during underwriting, suggesting either tax manipulation or poor planning.
What Underwriters Look For:
- Is D&A appropriately applied for asset classes?
- Does EBITDA provide strong debt coverage?
- Are assets still in usable condition despite depreciation?
- Is cash flow after D&A sufficient to service existing and new debt?
Example: Why Lenders Care About D&A
Two businesses with the same net income:
| Metric | Business A | Business B |
|---|---|---|
| Net Income | $300,000 | $300,000 |
| Depreciation & Amortization | $150,000 | $40,000 |
| EBITDA | $450,000 | $340,000 |

Final Thoughts on D&A
Depreciation and amortization might feel like behind-the-scenes accounting mechanics—but they play a front-line role in how your business reports profit, manages taxes, tracks assets, and secures financing.
By spreading out the cost of assets over time, D&A helps align your expenses with the value those assets deliver to your business. It tells a more realistic story about your financial performance and ensures that your reports aren’t overstating profit or ignoring wear and tear.
Whether you’re analyzing your company’s health, applying for financing, or planning long-term investments, understanding D&A helps you:
- Get a clearer picture of true cash flow
- Prepare for asset replacement and capital budgeting
- Speak the language of lenders, investors, and accountants
- Build smarter strategies around tax planning and profit margins
In short: D&A is more than an accounting line item — it’s a strategic tool.
Use it wisely, and you’ll not only stay compliant but also make better business decisions that pay off in the long run.
💡 Bonus: D&A tidbits
On the Balance Sheet
- Both Accumulated Depreciation and Accumulated Amortization are shown as contra-asset accounts, reducing the gross value of the assets.
- The net (book) value gives a more accurate picture of what remains of the asset’s economic benefit.
Useful Life & Salvage Value
- Useful Life: Estimated time the asset will provide economic benefit.
- Salvage Value: Residual value after useful life.
D&A in Financial Ratios
- EBITDA = Earnings Before Interest, Taxes, Depreciation, and Amortization
- ROA (Return on Assets): Affected by depreciation through net income and total assets.
- CapEx Coverage Ratio: EBITDA / Capital Expenditures