
Cap Rates
(Capitalization Rate)
“The Shorthand Read on Comm’l Property”
Capitalization Rate (Cap Rate): Connecting Income, Value, and Risk
A Capitalization Rate (Cap Rate) is a simple but powerful metric in commercial real estate finance that connects income, value, and risk in one simple formula.
Cap Rates sit in a peculiar spot of being simple and straightforward on the surface, but also possess a nuanced complexity.
(more on that below)
The Core Definition
A Capitalization Rate (Cap Rate) is the ratio of a property’s Net Operating Income (NOI) to its Current Market Value.
Formula (Definition):
Cap Rate = Net Operating Income (NOI) ÷ Current Market Value
- NOI = Property’s annual income after operating expenses (before debt service & taxes).
- Current Market Value = What the property could be bought or sold for in today’s market.
Example Calculation
A property generates $400,000 in NOI and has a market value of $6,000,000, the cap rate would be:
Cap Rate = $400,000 / $6,000,000 = 6.67% (0.0667)
This single number expresses the annual return an investor would earn if the property were purchased entirely with cash.
It’s a yield metric — telling you how much income (as a %) a property produces relative to what it’s worth in the market.
Interpreting Cap Rates
- Lower Cap Rate (e.g., 4%–5%) → Property trades at a higher price for the same NOI (perceived as lower risk).
- Higher Cap Rate (e.g., 7%–9%) → Property trades at a lower price for the same NOI (perceived as higher risk).
Cap rates vary by:
- Property Type (office, retail, industrial, multifamily, hotel).
- Location Quality (prime metro vs. secondary market).
- Tenant Strength & Lease Term (strong credit tenants and long leases push cap rates down).
- Market Conditions (interest rates, investor demand, and risk appetite).
Cap rates are useful for:
- Comparing Investments: They allow investors to compare the potential returns of different properties quickly.
- Assessing Risk: A higher cap rate typically indicates higher risk and potential reward, while a lower cap rate suggests lower risk.
How It Connects the Dots
- Income → The starting point is NOI, a property’s recurring income after operating expenses.
- Value → Investors apply market-based cap rates to NOI to determine what a property is worth today.
- Risk → Cap rates shift up or down depending on how the market perceives stability and uncertainty.
Put simply: higher risk = higher cap rate = lower property value; lower risk = lower cap rate = higher property value.
Example 1: Prime Retail Store (Downtown Location)
NOI: $750,000
Market Value: $15,000,000
Cap Rate: 750,000 ÷ 15,000,000 = 5%
💡 What It Means
A low cap rate (5%) shows investors are willing to accept a smaller yield because they see this property as low risk.
Factors driving this include:
Prime location in a thriving downtown core.
Strong tenant(s) such as national retail chains with long-term leases.
Stable cash flow with minimal vacancy risk.
👉 Takeaway: For owners, this means the property is highly valuable relative to its income — the market is rewarding stability with a premium valuation. For investors, it’s a “safe-bet” asset, but with lower returns.
Example 2: Suburban Office Building
NOI: $600,000
Market Value: $8,000,000
Cap Rate: 600,000 ÷ 8,000,000 = 7.5%
💡 What It Means
A higher cap rate (7.5%) signals that buyers demand more return for the risks they perceive.
Risk drivers could include:
Location risk — a suburban office park with weaker demand compared to downtown.
Tenant rollover — leases expiring soon, uncertainty about renewals.
Market headwinds — shifting demand for office space in a post-hybrid work environment.
👉 Takeaway: Owners may face lower valuations even if cash flow is solid. Investors are pricing in the uncertainty by requiring a higher yield.
(with respect to the above examples):
Cap Rate Compression (5%) = Stability, liquidity, and long-term investor demand.
Cap Rate Expansion (7.5%) = Higher risk, uncertainty, or weaker demand.
Interpreting Cap Rates:
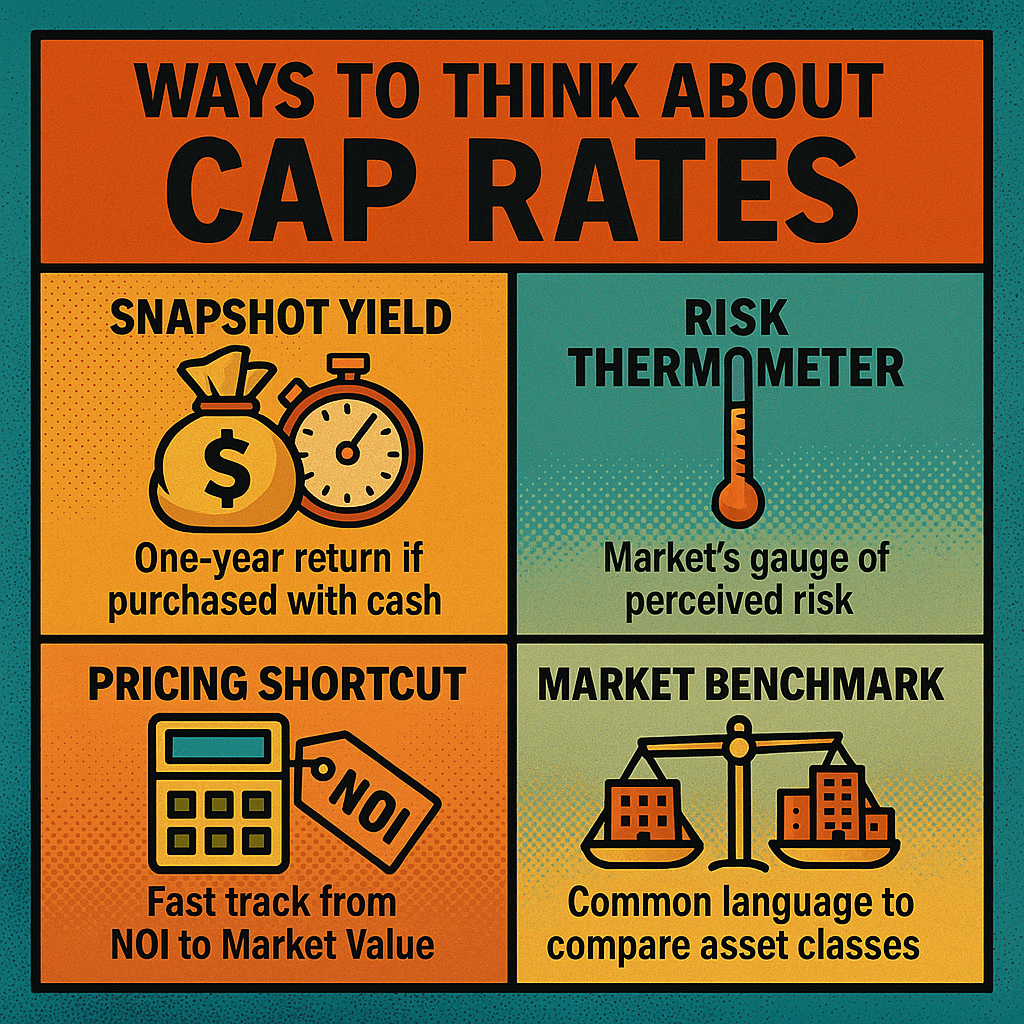
Expanded Utilization
Snapshot Yield → What’s the one-year return today?
Risk Thermometer → How safe or risky is the market judging it?
Pricing Shortcut → How do I back into property value quickly?
Market Benchmark → How does this deal compare to others?
Snapshot Yield
A cap rate shows the one-year return an investor would earn if the property were purchased entirely with cash.
- It’s a quick way to see how much income the property generates relative to its price.
Example:
If a property generates $500,000 NOI and is worth $10,000,000, the cap rate is 5%.
★ That means the investor is effectively earning a 5% annual return on the purchase price.
Risk Thermometer
A cap rate is like a market risk gauge.
- Lower cap rates = investors perceive less risk (prime locations, strong tenants, stable income).
- Higher cap rates = investors demand more return to take on more risk (secondary markets, short leases, volatile income).
Example:
A downtown office tower might trade at a 4.5% cap, reflecting stable tenants and high demand.
A suburban office park could trade at an 8% cap, signaling investors want a higher return because of lease rollover risk.
★ Think of it as the property’s “interest rate” set by market perception.
Pricing Shortcut
A cap rate is the market’s shortcut to property value.
- It lets investors translate income (NOI) into today’s price without needing a full discounted cash flow model.
Example:
If market comps show 6% cap rates for neighborhood retail centers, and your NOI is $600,000, then:
Value = NOI ÷ Cap Rate = 600,000 ÷ 0.06 = $10,000,000
★ With just NOI and the market cap rate, you can back into property value instantly.
Market Benchmark
Cap rates act as a benchmark between asset classes and geographies.
- They let you compare where your money works harder.
Example:
- Industrial warehouse at 5.5% cap → NOI $1,100,000 → Value $20,000,000.
- Retail center at 7% cap → Same NOI $1,100,000 → Value $15,714,000.
★ The same income is valued differently, so cap rates let you weigh risk-adjusted return across asset types.

The Double Nature of Cap Rates (the Simplicity/Complexity duality)
The Simplicity
- One clear formula: Cap Rate = NOI ÷ Market Value.
- Quick read: Tells you the property’s yield today, no spreadsheets required.
- Easy comparison: Lets you benchmark assets side-by-side across markets and property types.
✪ This is why brokers, bankers, and owners love to quote cap rates — they provide instant clarity.
The Nuanced Complexity
- NOI isn’t always “clean”: What’s included (or excluded) in operating expenses can shift NOI.
- Market value is subjective: Comparable sales, investor appetite, and financing conditions drive pricing, which then drives the “cap rate.”
- Dynamic with risk: Cap rates compress or expand with tenant strength, lease length, location, and macroeconomic factors (like interest rates).
- Not future-proof: Cap rate is a snapshot, not a forecast — it doesn’t model growth, rent escalations, or vacancies.
✪ Beneath the simplicity, interpreting cap rates properly requires judgment and market context.
💡 Bonus: Cap Rates Quick Reference Table*
| Property Type | Typical Cap Rate Range | Risk Profile | Notes |
|---|---|---|---|
| Prime Office (Class A, Core Market) | 4% – 5.5% | Low | Strong tenants, trophy locations, stable demand. |
| Suburban / Secondary Market Office | 6% – 8% | Medium | Higher vacancy risk, less liquidity. |
| Retail – Grocery Anchored / Core Urban | 4.5% – 6% | Low | Essential services, resilient tenant mix. |
| Retail – Power Centers / Secondary Locations | 6.5% – 8.5% | Medium–High | Tenant turnover, e-commerce headwinds. |
| Industrial / Logistics (Core Markets) | 5% – 6.5% | Low–Medium | Strong demand from e-commerce; often competitive pricing. |
| Industrial / Flex / Secondary Market | 7% – 9% | Medium–High | Older facilities, niche tenants. |
| Multifamily – Urban Class A | 4% – 5.5% | Low | High demand, stable cash flows, competitive pricing. |
| Multifamily – Suburban / Class B-C | 6% – 8% | Medium | Dependence on local employment trends. |
| Hospitality / Hotels (Urban Core) | 7% – 9% | High | Income tied to tourism, highly cyclical. |
| Specialty / Single-Tenant (NNN Leases) | 5% – 7% | Low–Medium | Heavily dependent on tenant creditworthiness. |
*Cautions in Using Cap Rate Tables
Cap rate ranges are helpful benchmarks but not absolute truths. A few cautions:
- Market-Specific:
A “retail cap rate” in downtown Manhattan could be 4.5%, while in a tertiary Midwest city it might be 8%. Tables often average across broad categories. - Asset Quality:
Cap rates depend heavily on tenant quality, lease terms, and building condition. A fully leased grocery-anchored center trades much lower than a strip center with vacancies. - Timing:
Cap rates shift quickly with interest rates, capital flows, and risk sentiment. A 6% suburban office cap in 2021 might now be 8%+ in 2025. - Not a Full Valuation Tool:
Cap rates only measure current NOI, ignoring future rent growth, lease rollover, capital expenditures, or redevelopment potential. - Blended Ranges:
“Quick reference” tables are broad generalizations — they’re best used as a first-pass screen or discussion tool, not as a substitute for market-specific comps.