
Financial Statements
(the fundamentals)
“Paperwork that talks.”
Financial Statements are the core reports that show the financial condition, performance, and cash activity of a business.
They provide a common language for owners, managers, lenders, and investors to understand how a company is really doing.
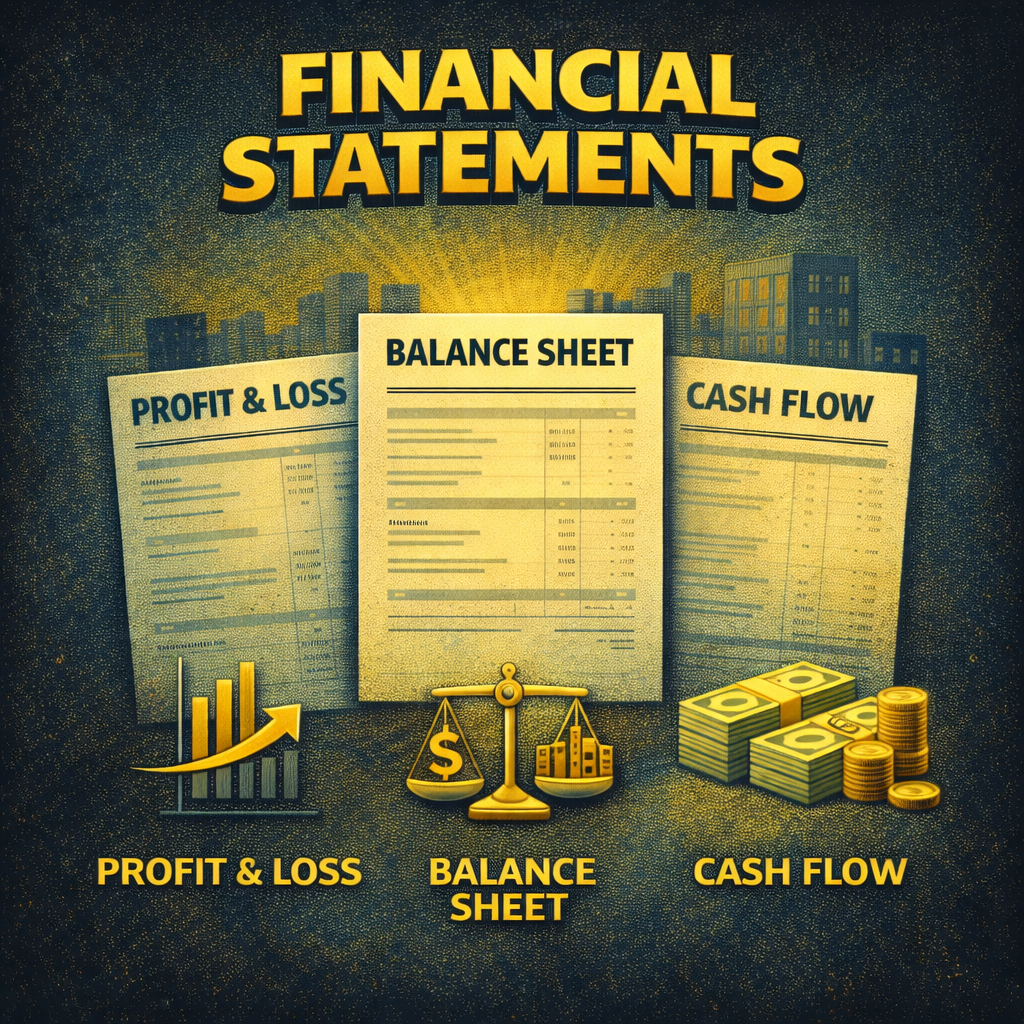
The Big Three (at a glance):
Balance Sheet → A snapshot of assets, liabilities, and equity at a specific point in time.
Profit & Loss Statement (Income Statement) → A summary of revenues, expenses, and profits over a period.
Cash Flow Statement → A record of actual inflows and outflows of cash.
Together, they answer three essential questions:
What do we own and owe? (Balance Sheet)
Are we making or losing money? (P&L)
Have we the cash to survive and grow? (Cash Flow Stmt.)
Example Snapshot
Imagine a company with:
Balance Sheet: $1,000,000 in assets, $700,000 in liabilities → Equity = $300,000.
P&L Statement: $2,000,000 in revenue, $1,800,000 in expenses → Net Profit = $200,000.
Cash Flow Statement: $200,000 profit, but only $50,000 positive operating cash flow due to late receivables.
Taken together, these show: the company has equity strength, is profitable, but faces a potential cash crunch that needs attention.
The Big Three
( in greater detail )
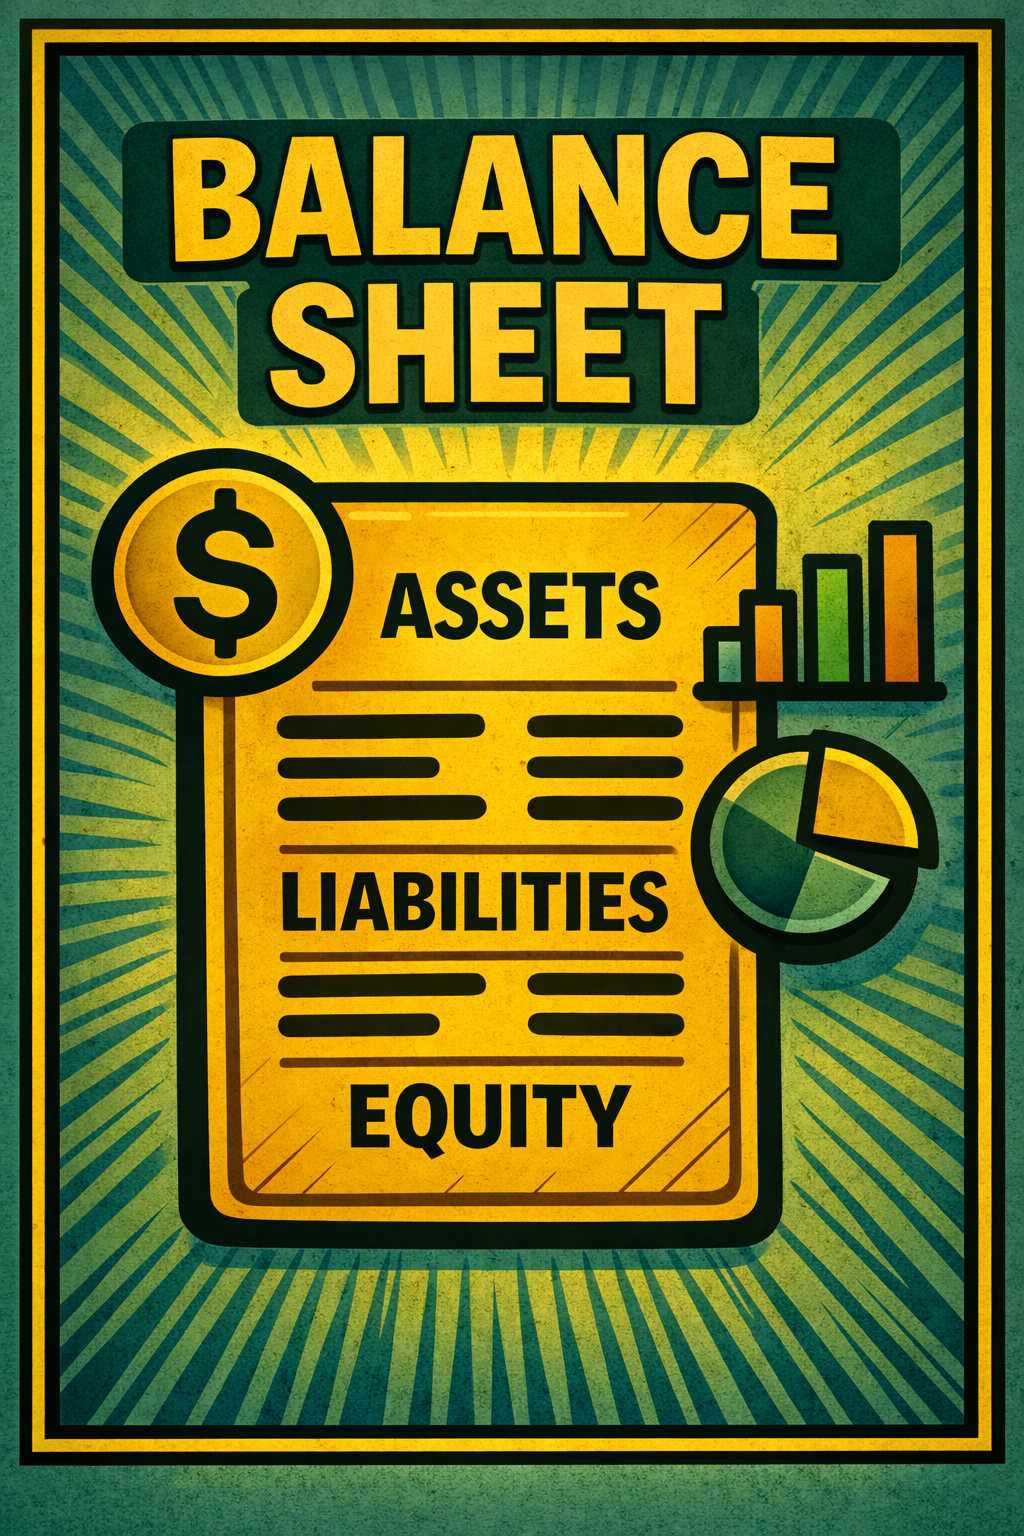
Balance Sheet
Snapshot of financial position at one specific moment in time (like a photo of the business).
Built on the equation: Assets = Liabilities + Equity.
Reveals what the business owns (assets), what it owes (liabilities), and what’s left for the owners (equity).
Key insights: Solvency (can we cover our debts?), leverage (how much do we rely on borrowing?), and equity strength (the owner’s stake in the company).
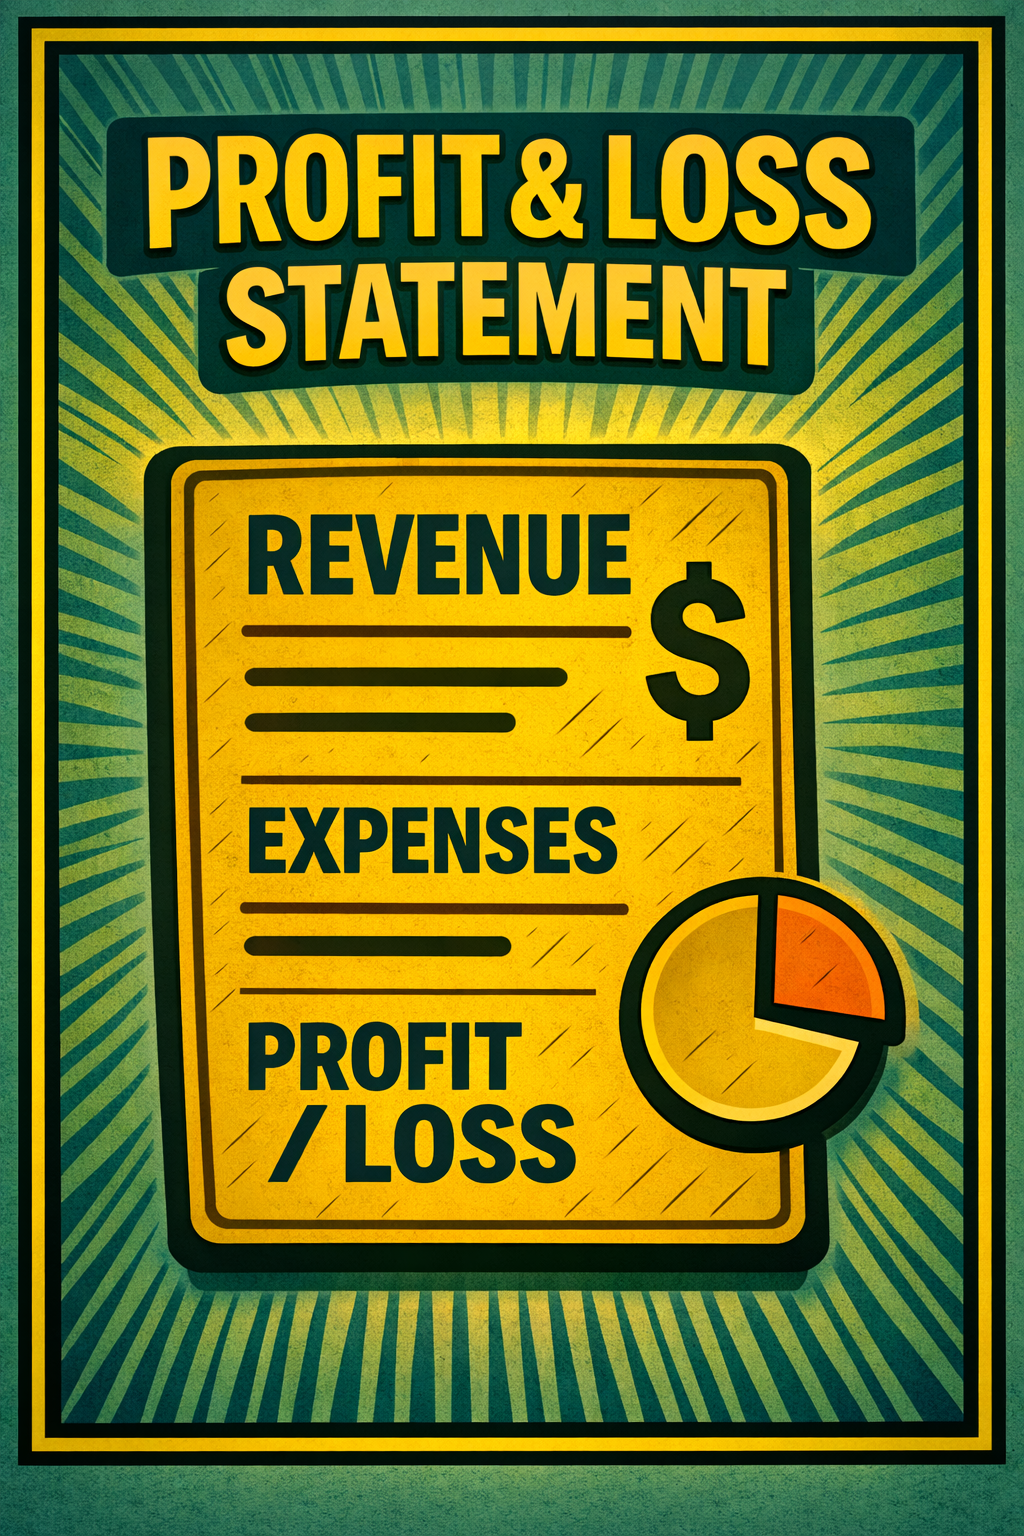
Profit & Loss (P&L) Statement
Measures financial performance over a period (month, quarter, or year).
Tracks revenues, expenses, and profits, showing whether operations are generating value.
Helps identify whether sales are translating into real profit.
Key insights: Profitability trends, efficiency, and cost control. The P&L answers the question: “Are we actually making money?”
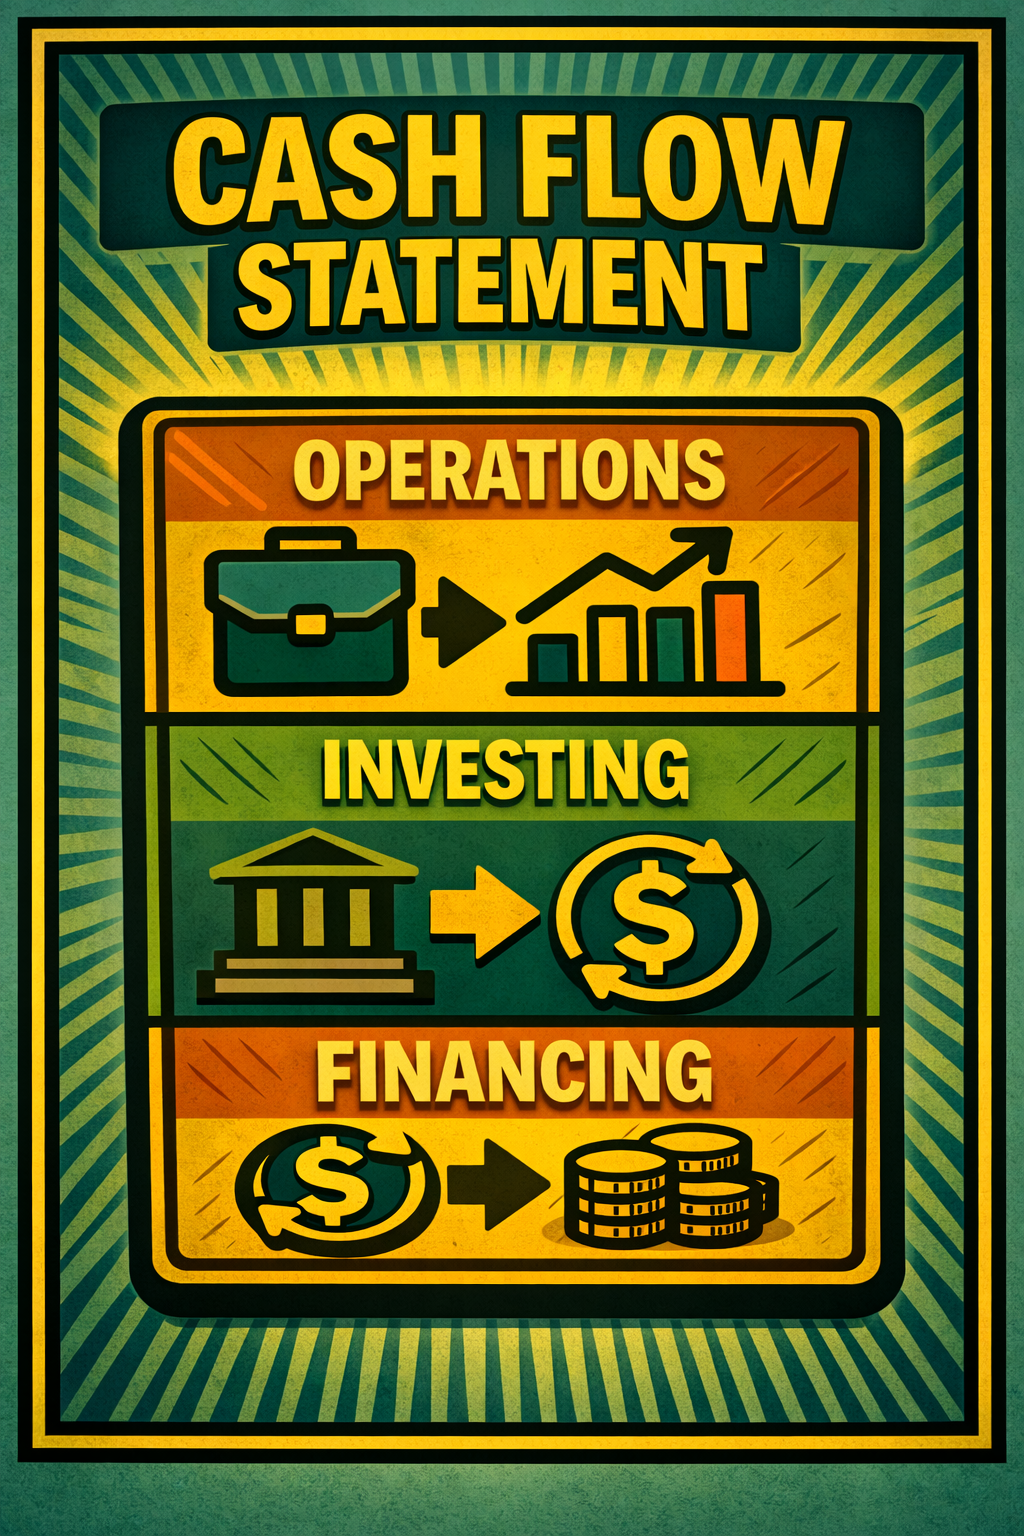
Cash Flow Statement
Shows the actual flow of cash in and out of the business. Divided into:
Operating activities (day-to-day business),
Investing activities (purchases or sales of long-term assets),
Financing activities (borrowing, repayments, owner distributions).
Explains why a profitable company may still struggle with cash shortages.
Key insights: Liquidity, sustainability, and funding capacity. The cash flow statement answers: “Do we have the cash to survive and grow?”
📊 Example: Strong Profit, Weak Balance Sheet
Balance Sheet: $500,000 in assets, $480,000 in liabilities → Equity = $20,000.
P&L Statement: $1,200,000 in revenue, $1,000,000 in expenses → Net Profit = $200,000.
Cash Flow Statement: $200,000 profit, $180,000 operating cash flow.
Interpretation:
The company is profitable and generating cash, but its equity is razor thin compared to liabilities. One downturn could wipe out its value. A lender might hesitate without additional collateral or guarantees.
📊 Example: Strong Balance Sheet, Weak Profitability
Balance Sheet: $2,000,000 in assets, $1,000,000 in liabilities → Equity = $1,000,000.
P&L Statement: $900,000 in revenue, $880,000 in expenses → Net Profit = $20,000.
Cash Flow Statement: $20,000 profit, but $10,000 negative operating cash flow (inventory buildup).
Interpretation:
The company has a healthy equity cushion, but its operations are barely breaking even. Without improved profitability, the strong balance sheet could slowly erode.
✦ The Importance of Understanding Financial Statements ✦
Financial statements are more than just paperwork for accountants — they’re the navigation system of a business. They show where a business stands today, how it has performed over time, and whether it has the cash to keep moving forward.
Clarity: They cut through guesswork, giving owners a true picture of financial health.
Control: They highlight risks (like debt overload or weak cash flow) before they become crises.
Credibility: Lenders and investors rely on them to judge strength and stability.
Confidence: Business leaders who understand their statements make smarter, faster, and more strategic decisions.
Bottom line:
If you don’t understand your financial statements, you’re flying blind. If you do, you’re steering with a clear map in hand.

Financial Statements Best Practices
| Best Practice | What It Means |
|---|---|
| Keep Them Accurate & Timely | Record transactions consistently, reconcile accounts, and produce statements promptly. |
| Review All Three Together | Balance Sheet, P&L, and Cash Flow work as a set — never rely on just one report. |
| Focus on Trends, Not Snapshots | Compare results over time to spot patterns in margins, debt, and cash cycles. |
| Use Ratios & Metrics | Convert numbers into insights with tools like current ratio, margins, debt-to-equity, DSCR. |
| Tie Them to Decision-Making | Use financials to guide hiring, expansion, borrowing, and distribution decisions. |
| Don’t Ignore Cash Flow | Profit isn’t enough — monitor operating cash flow to ensure survival and growth. |
| Get Professional Support | Work with accountants or advisors for accuracy, but understand the basics yourself. |