
Financial Ratios
“From Red Flags to Green Lights”
Understanding Financial Ratios & Analysis:
Financial ratios are simple calculations derived from financial statements that reveal the story behind the numbers.
They help to:
Assess profitability, liquidity, and overall financial stability.
Compare performance over time or against industry benchmarks.
Support strategic planning, lending decisions, and investor confidence.
Financial ratios and analysis give business owners, executives, decision-makers, and lenders a clear, measurable way to evaluate performance, identify risks, and uncover growth opportunities. Whether you’re running a small business or leading a larger enterprise, these tools provide the insights you need to make smarter, data-driven decisions.
For Business Owners and Decision Makers: It highlights where your business is strong and where improvement is needed—whether it’s tightening cash flow, reducing debt, or boosting profitability.
For Lenders: Ratios provide an objective view of financial health, helping determine creditworthiness, repayment ability, and long-term viability.
For Growth Planning: Analysis helps you forecast, model “what-if” scenarios, and make informed investments in people, equipment, or expansion.
In short, when used effectively, financial ratios transform raw accounting data into actionable intelligence
and financial analysis turns complex financial data into a decision-making compass.
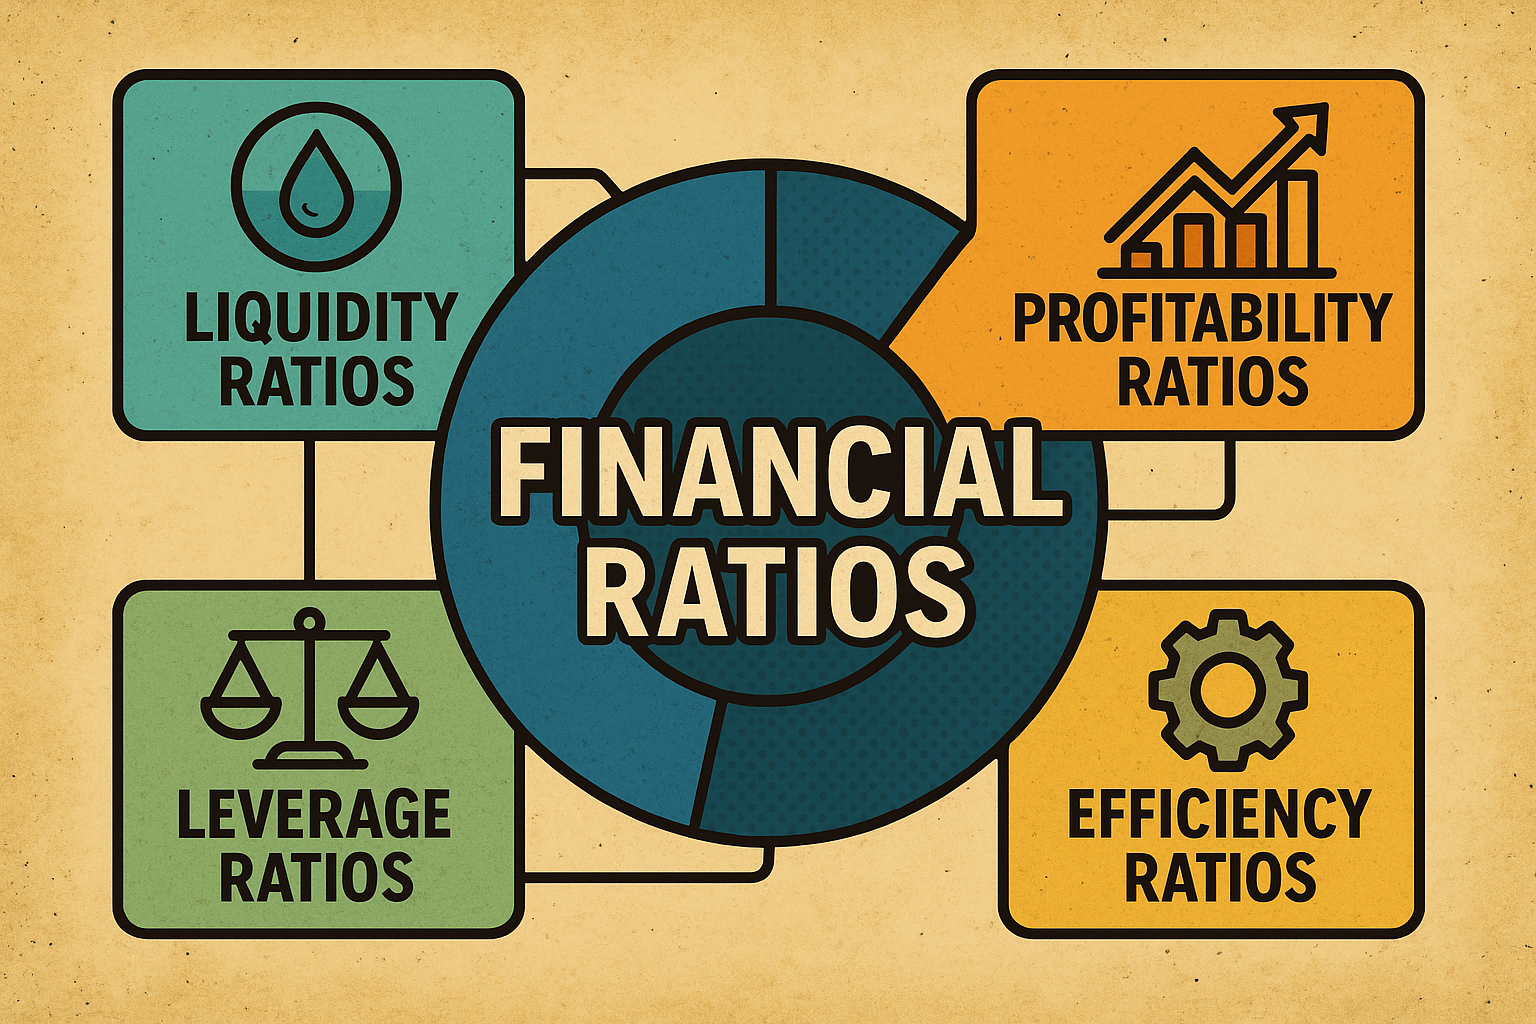
Key Categories of Financial Ratios
Financial ratios fall into four main categories…
• Liquidity • Profitability • Leverage • Efficiency •
….each offering a unique perspective on your business’s financial health. Understanding these ratios helps business owners, bankers, and decision makers make informed decisions with confidence.
Liquidity Ratios
“Cash Flow Check”
Purpose: Measure a company’s ability to meet short-term obligations without raising additional capital.
Liquidity Ratios & Examples:
- Current Ratio = Current Assets ÷ Current Liabilities
Example: If your business has $200,000 in current assets and $100,000 in current liabilities, your Current Ratio is 2.0, meaning you have $2 in assets for every $1 in liabilities.
- Quick Ratio (Acid-Test) = (Current Assets – Inventory) ÷ Current Liabilities
Example: If inventory is $50,000, your Quick Ratio is 1.5, showing strong liquidity without relying on inventory sales.
- Cash Ratio = Cash & Cash Equivalents ÷ Current Liabilities
Example: If you have $60,000 cash and $100,000 liabilities, the Cash Ratio is 0.6, meaning you could cover 60% of short-term obligations using cash alone.
Notes: Liquidity ratios help ensure you have enough working capital to pay bills, suppliers, and employees on time—reducing financial stress and avoiding potential credit issues.
Profitability Ratios
“Margins That Matter”
Purpose: Evaluate how efficiently a business generates profit from sales, assets, and equity.
Examples & Formulas:
- Gross Margin = (Revenue – Cost of Goods Sold) ÷ Revenue
Example: $500,000 in sales with $300,000 COGS results in a Gross Margin of 40%—a healthy indicator of pricing and production efficiency.
- Net Profit Margin = Net Income ÷ Revenue
Example: $50,000 net income from $500,000 revenue equals 10% Net Profit Margin.
- Return on Assets (ROA) = Net Income ÷ Total Assets
Example: $50,000 income ÷ $400,000 assets = 12.5%, showing how effectively you use assets to generate profit.
- Return on Equity (ROE) = Net Income ÷ Shareholder Equity
Example: $50,000 income ÷ $250,000 equity = 20%, a strong indicator of value creation for owners.
Notes: Profitability ratios are critical for growth planning, cost control, and attracting investors or lenders who want to see sustainable returns.
Leverage (Solvency) Ratios
“Balance The Load”
Purpose: Assess long-term financial risk and whether a business can handle its debt load.
Leverage Ratios & Examples:
- Debt-to-Equity Ratio = Total Debt ÷ Shareholder Equity
Example: $300,000 debt ÷ $200,000 equity = 1.5, meaning you have $1.50 in debt for every $1 of equity.
- Interest Coverage Ratio = EBIT (Earnings Before Interest & Taxes) ÷ Interest Expense
Example: $120,000 EBIT ÷ $30,000 interest = 4.0, showing strong ability to meet interest payments.
Notes: Lenders and investors use leverage ratios to determine if your business is financially stable or overextended.
A balanced capital structure improves your borrowing capacity and reduces financial risk.
Efficiency (Activity) Ratios
“Work Those Assets”
Purpose: Measure how well a company uses assets and manages operations to generate revenue.
Efficiency Ratios & Examples:
- Inventory Turnover = Cost of Goods Sold ÷ Average Inventory
Example: $300,000 COGS ÷ $60,000 average inventory = 5 turns, indicating efficient inventory management.
- Accounts Receivable Turnover = Net Credit Sales ÷ Average Accounts Receivable
Example: $500,000 credit sales ÷ $50,000 receivables = 10, meaning customers pay on average every 36 days (365 ÷ 10).
- Asset Turnover = Revenue ÷ Total Assets
Example: $500,000 revenue ÷ $400,000 assets = 1.25, showing strong asset utilization.
Notes: Higher efficiency ratios indicate better cash flow, reduced waste, and stronger operational performance—critical for scaling your business without tying up unnecessary capital.
Financial Ratios Quick Reference Table
| Category | Ratio | Formula | Ideal* Benchmark |
| Liquidity | Current Ratio | Current Assets ÷ Current Liabilities | 1.5 – 2.0 |
| Liquidity | Quick Ratio | (Current Assets – Inventory) ÷ Current Liabilities | ≥ 1.0 |
| Liquidity | Cash Ratio | Cash & Equivalents ÷ Current Liabilities | 0.5 – 1.0 |
| Profitability | Gross Margin | (Revenue – COGS) ÷ Revenue | 40% – 60% |
| Profitability | Net Profit Margin | Net Income ÷ Revenue | 10% – 20% |
| Profitability | Return on Assets (ROA) | Net Income ÷ Total Assets | ≥ 5% |
| Profitability | Return on Equity (ROE) | Net Income ÷ Shareholder Equity | ≥ 10% |
| Leverage (Solvency) | Debt-to-Equity Ratio | Total Debt ÷ Shareholder Equity | < 2.0 |
| Leverage (Solvency) | Interest Coverage Ratio | EBIT ÷ Interest Expense | ≥ 3.0 |
| Efficiency (Activity) | Inventory Turnover | COGS ÷ Average Inventory | 4 – 6 times/year |
| Efficiency (Activity) | Accounts Receivable Turnover | Net Credit Sales ÷ Average Accounts Receivable | 8 – 12 times/year |
| Efficiency (Activity) | Asset Turnover | Revenue ÷ Total Assets | ≥ 1.0 |
* Emphasis on “Ideal”. Ratio values must be interpreted within the context of your industry, growth stage, company size, and economic conditions.
How Lenders and Bankers Use Ratios
If you’re seeking financing, lenders rely heavily on ratio analysis to assess:
- Creditworthiness and repayment ability.
- Financial risk and leverage levels.
- Operational efficiency and profitability trends.
Understanding these metrics helps you speak the same language as bankers and improve your chances of securing favorable funding.

Best Practices with Financial Ratios
Understand the Context of Each Ratio
- Why: Ratios are indicators, not standalone answers. They must be interpreted within the context of your industry, company size, and economic conditions.
- Example: A current ratio of 1.2 may be acceptable for a grocery store (fast-moving inventory) but risky for a manufacturing firm with slower inventory turnover.
- Tip: Compare ratios against industry benchmarks or competitors.
Use a Balanced Set of Ratios
- Why: Focusing on one ratio (e.g., profitability) without considering liquidity or leverage can lead to financial blind spots.
- Example: A company may show a strong net profit margin, but if the quick ratio is low, it may still face cash flow problems.
- Tip: Track at least one ratio from each key category: Liquidity, Profitability, Leverage, Efficiency.
Analyze Trends, Not Just Snapshots
- Why: One-time measurements can be misleading. Long-term trends show whether your financial health is improving or deteriorating.
- Example: Debt-to-equity ratio decreasing over 3 years shows improved financial stability.
- Tip: Use 3–5 years of historical data to identify trends and predict future performance.
Integrate Ratios into Decision-Making
- Why: Ratios are most powerful when used to guide actions, not just monitor performance.
- Example: If inventory turnover is low, implement tighter inventory control or renegotiate supplier terms to reduce holding costs.
- Tip: Link ratios to KPIs and business objectives in dashboards or scorecards.
Benchmark Against Peers and Industry Standards
- Why: Industry norms provide a realistic yardstick for performance.
- Example: A gross margin of 30% might be excellent in wholesale but poor in SaaS.
- Tip: Use resources like trade associations, financial databases, or market research reports for benchmarks.
Use Ratios in Forward-Looking Analysis
- Why: Financial ratios should inform strategy, not just report history.
- Example: Projecting cash ratio after a major equipment purchase helps plan financing needs.
- Pro Tip: Combine ratios with forecasting tools for scenario planning.
Seek Professional Guidance When Needed
- Why: Complex financial decisions may require expert input.
- Example: Before taking on significant debt, consult a banker or financial advisor to understand impact on your interest coverage ratio and leverage risk.
- Tip: Use ratios in conversation with financial professionals.
✅ Bottom Line for Business Decision Makers:
Financial ratios are powerful, but only if used in context, tracked consistently, and connected to strategic actions.
The key is not just knowing the numbers but using them to make smarter, data-driven business decisions.